Monitoring your Node(s)
To monitor a node in the network, you can either observe your own node's status or the entire network. Monitoring your own node can give you insight into its status, and setting up a monitoring dashboard using Prometheus and Grafana is commonly used. To monitor the network, options include ethstats, forkmon, beacon.gnosischain, and blockscout, each providing different types of information about the network and validator related metrics.
Monitoring your own node with Prometheus + Grafana
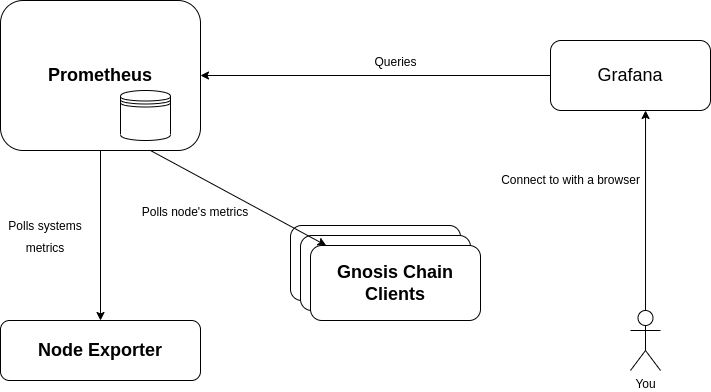
Prometheus is a systems monitoring tool that pulls data from certain endpoint and stores the data into a database. Grafana is a data visualisation tool that allows user to create their own dashboard from different data sources, including Prometheus. Node exporter is a monitoring tool that exposes your hardware and OS metrics. It can provide your system metrics to Prometheus.
To set up these tools, please refer to the excellent guide from ethstaker on how to do monitoring for an Ethereum validator.
You may also refer to the Ethereum Setup Instructions and CoinCashew's guide for best monitoring practices.
In order to expose your node's clients data to Prometheus, please ensure the execution or consensus client has enabled the appropriate metrics flag.
Default metrics port
| Client | Port |
|---|---|
| Nethermind | 6060 |
| Reth | 9001 |
| Geth | 6060 |
| Erigon | 6060 |
| Lighthouse Beacon | 5054 |
| Lighthouse Validator | 5064 |
| Lodestar Beacon | 8008 |
| Lodestar Validator | 5064 |
| Teku (Beacon & Validator) | 8008 |
| Nimbus (Beacon & Validator) | 8008 |
Execution client
- Nethermind
- Reth
- Geth
- Erigon
--Metrics.Enabled true
--Metrics.ExposePort $PORT
--Metrics.PushGatewayUrl
--metrics 127.0.0.1:$PORT
- Prometheus metrics are served on
/metrics. - https://reth.rs/cli/cli/
- https://reth.rs/run/faq/ports/
--metrics
--metrics.addr 127.0.0.1
--metrics.port $PORT
- Prometheus-formatted metrics are served on
/debug/metrics/prometheus. - https://geth.ethereum.org/docs/monitoring/metrics
--metrics
--metrics.addr=0.0.0.0
- By default,
metricsuses port6060. - If
--pprofis also enabled, configure a separate--pprof.port. - https://github.com/erigontech/erigon#other-ports
Consensus client
- Lighthouse
- Lodestar
- Teku
- Nimbus
--metrics
--metrics-port=$PORT

https://lighthouse-book.sigmaprime.io/advanced_metrics.html
https://github.com/sigp/lighthouse-metrics
--metrics=true
--metrics.port=$PORT
--metrics-enabled=true
    --metrics
    --metrics-port=$PORT
https://nimbus.guide/metrics-pretty-pictures.html#simple-metrics
Monitoring the network
Ethstats
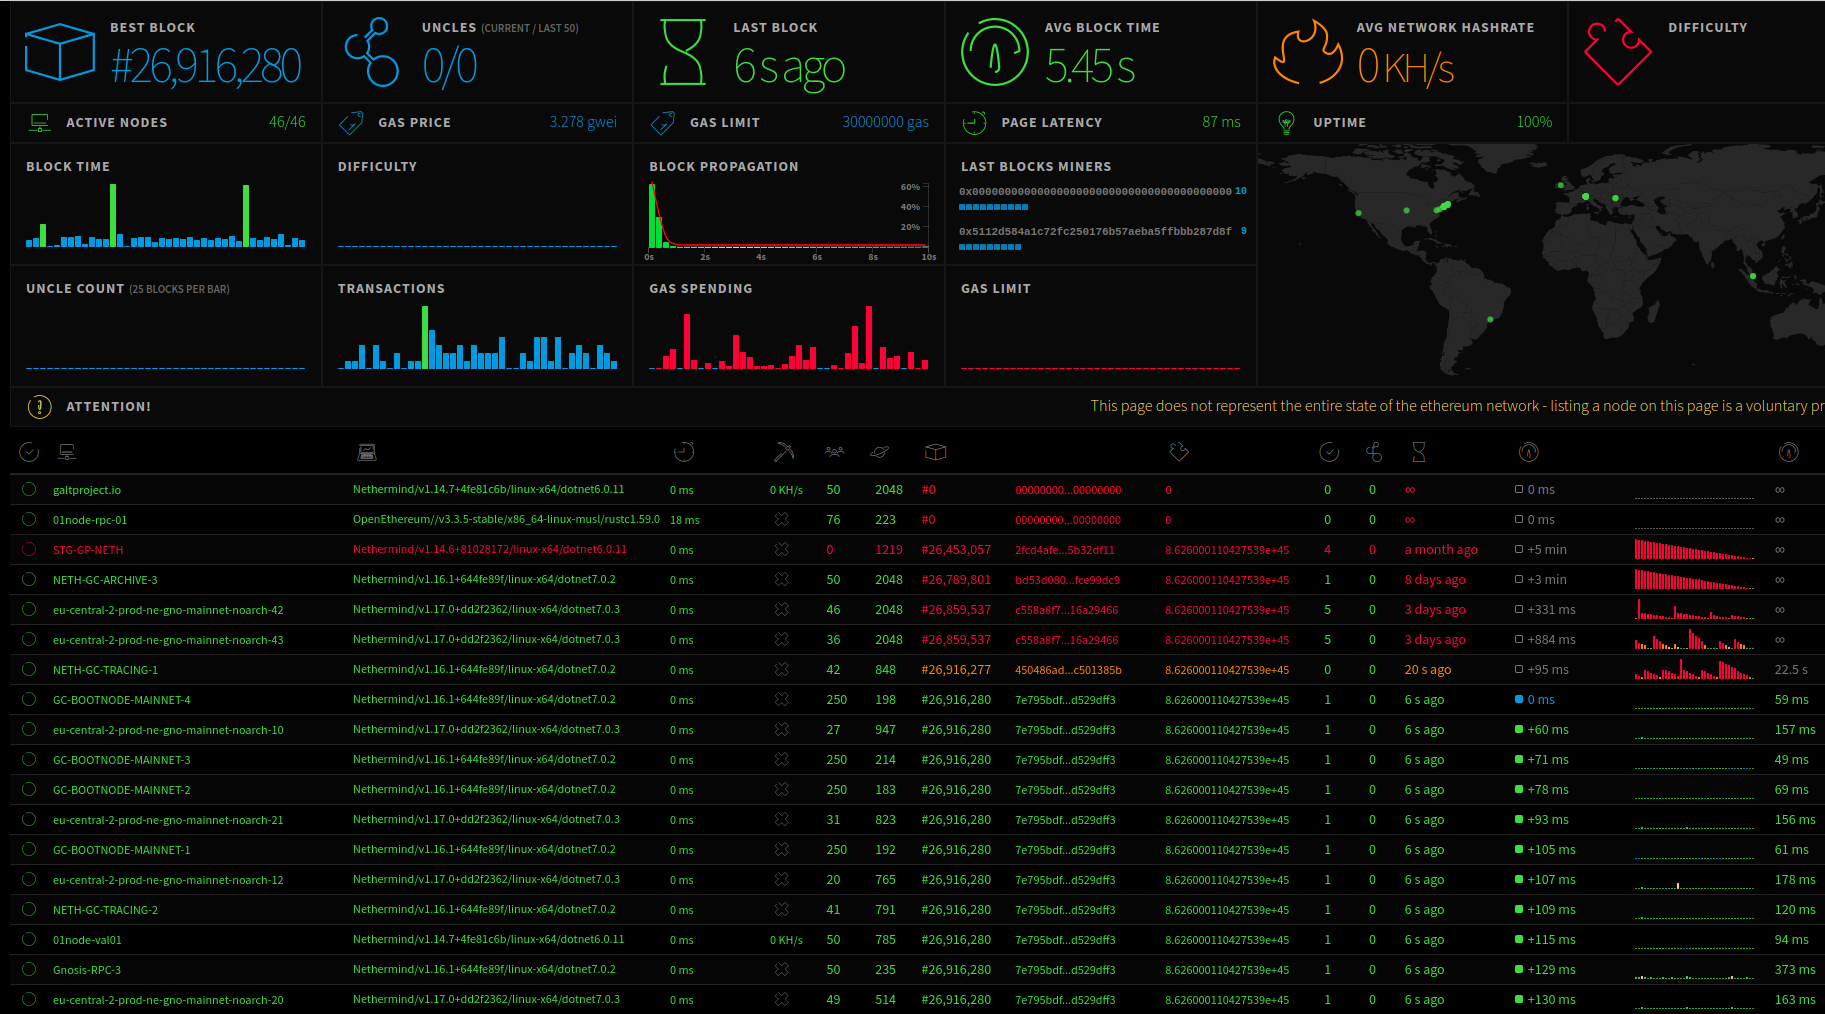
Ethstats provides real-time insight about the entire state of Gnosis network such as Block Time, Transactions per block, Gas per block; as well as individual node's metrics such as node's OS, Execution client version, peers number, etc.
By default, your node data will not be listed on the ethstats page. Listing a node on ethstats is a voluntary process.
To enable ethstats module in Nethermind, set --EthStats.Enabled true.
- Gnosis chain: https://ethstats.gnosischain.com/
- Chiado: https://ethstats.chiadochain.net/
Forkmon
Forkmon (Fork monitor) is another tool to monitor Node's status.
- Gnosis Chain: https://forkmon.gnosischain.com/
- Chiado: https://forkmon.chiadochain.net/
d14n.info
The site is deprecated
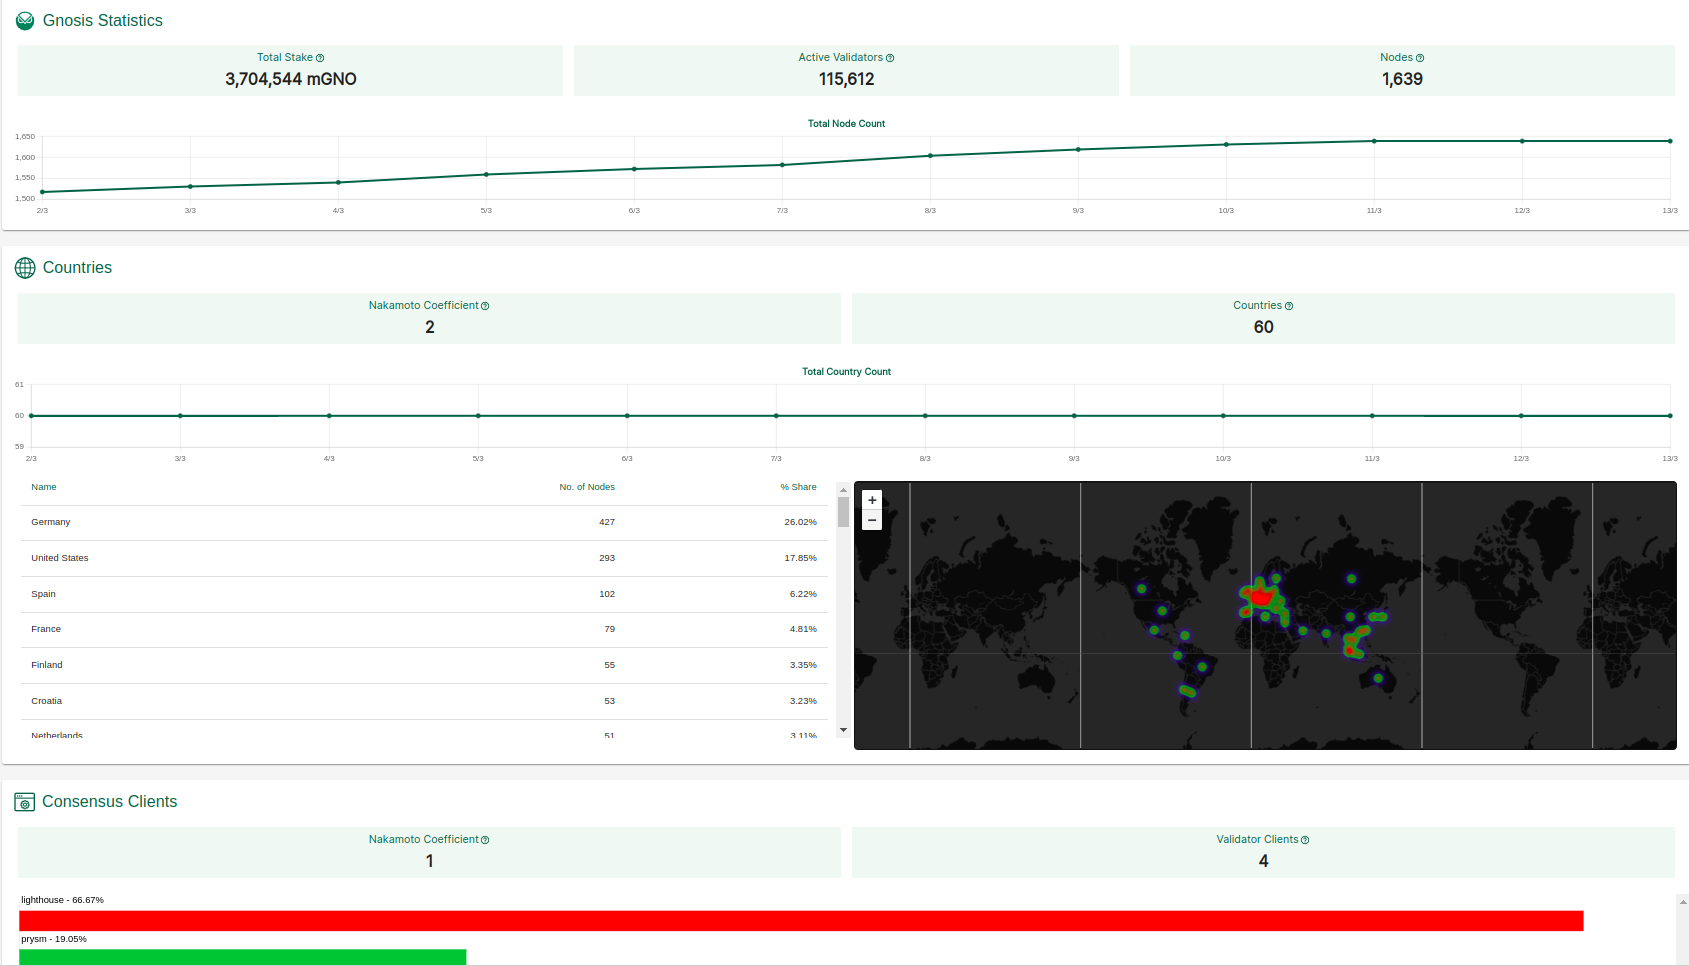
d14n.info is a real-time dashboard that measures decentralization of Gnosis Chain and Ethereum networks.
GnosisPools.info
GnosisPools.info allows you to monitor the performance of Gnosis consensus staking pool. Some of the metrics you can track include:
- % of inactive validators
- Delta in rewards/penalties between consecutive epochs
- Proposed and missed blocks for each epoch
Block explorer
Execution Layer
-
Gnosisscan provides data about blocks, transactions, validator's reward on Execution Layer, etc.
To check your Execution Layer Reward (in xDAI):
- Search your
fee-recipient-addressthat is set when running validator - Click Validated Blocks
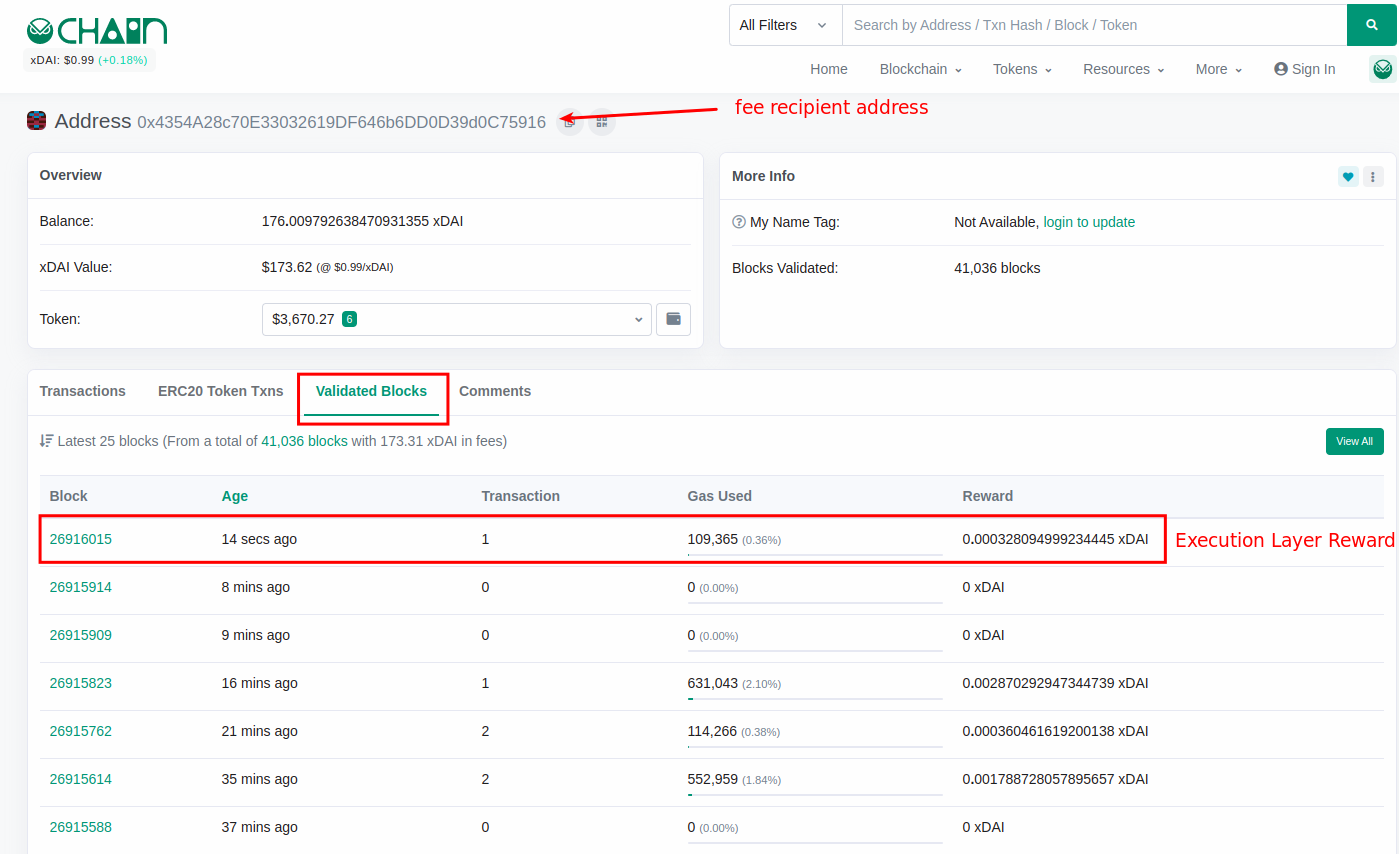
- Search your
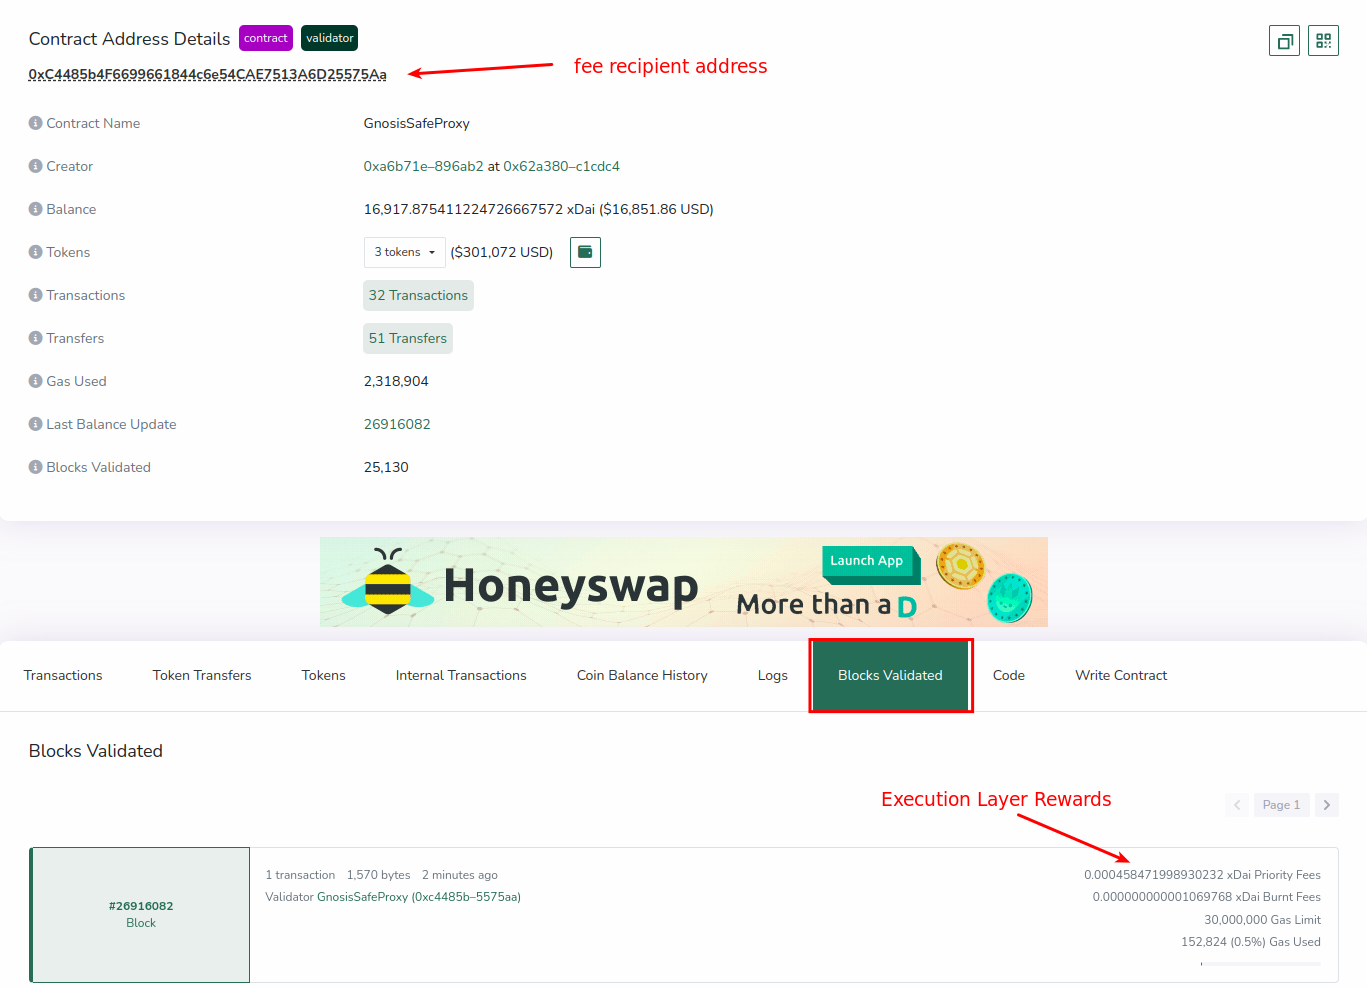
-
Blockscout is another block explorer similar to Gnosisscan.
Consensus Layer
-
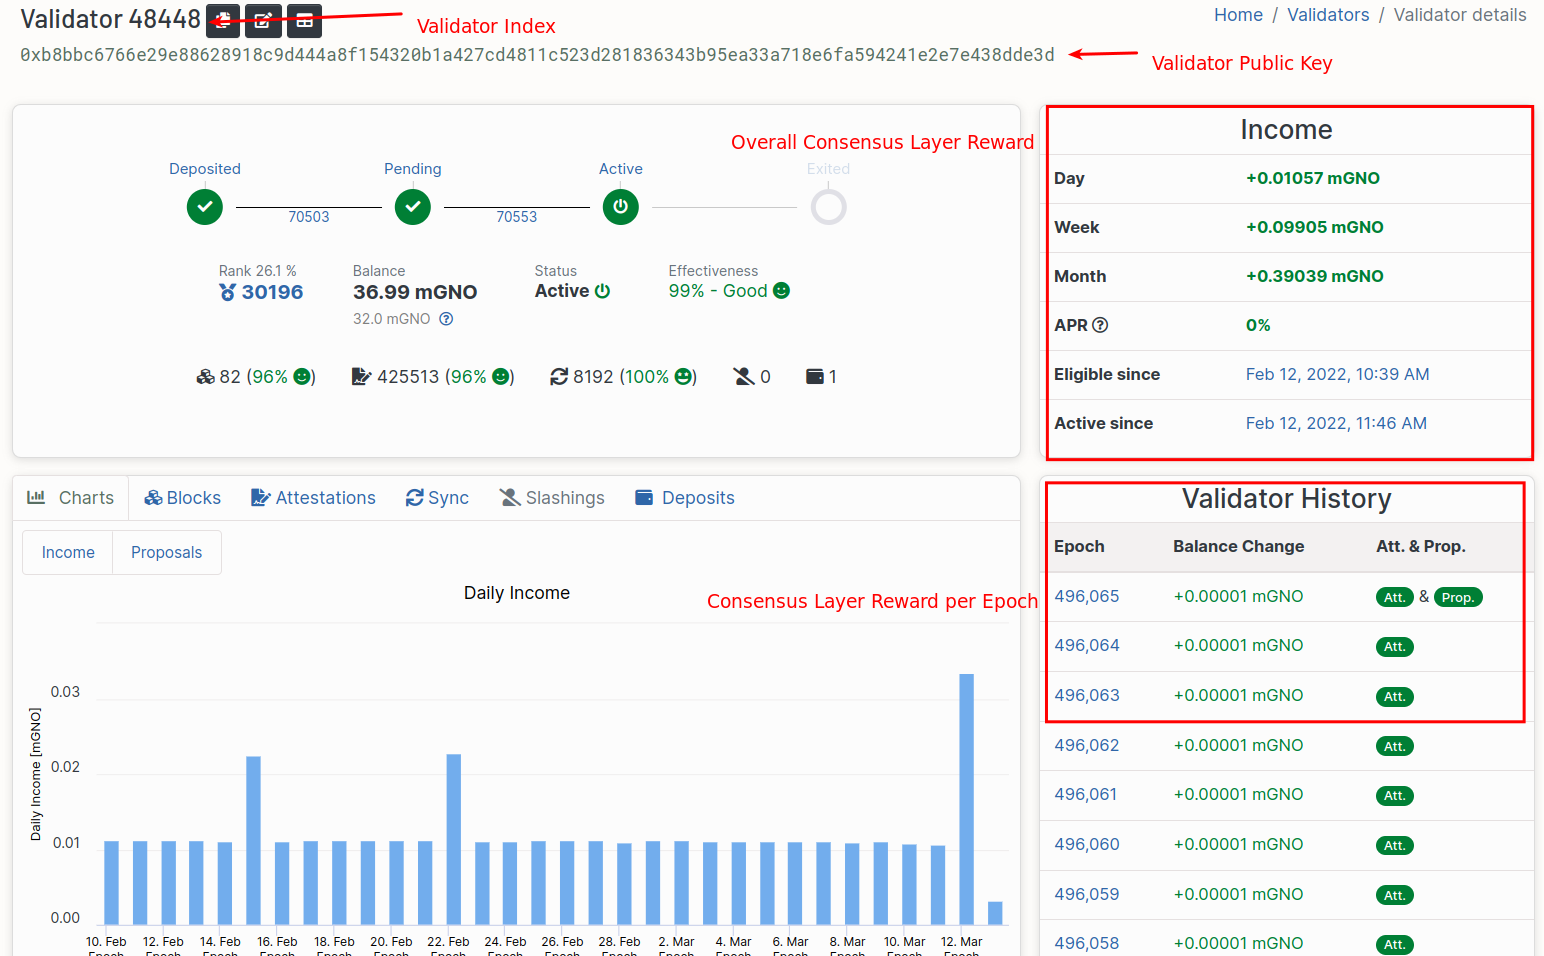
Beacon chain explorer provides insight on consensus layer such as most recent epochs, most recent blocks, and validator's reward on Consensus layer. You can view your validator's info by using its public key or index.
To check your Consensus Layer Reward (in mGNO):
- Search your validator by Index or Public Key.
- Income section indicates the overall consensus layer reward the validator has gained, Validator History shows the reward per epoch.